 Open in Modal Notebook
View on GitHub
Open in Modal Notebook
View on GitHub The observability dashboard
Deploy and use the observability dashboard — track runs, inspect rollouts, and profile step timings
Every training run, deployment, and eval launched through
modal-training-gym writes metadata to a shared Modal Volume. The
observability dashboard is a Modal web app that reads that volume and
gives you a live view of everything the package is doing in your
workspace: which runs are on which step, how rewards are trending, what
each rollout actually generated, and where each training step spends its
time.
This guide covers deploying the dashboard, a tour of its tabs and features, and how to profile step and substep timings.
Deploy the dashboard
Section titled “Deploy the dashboard”Deploy (or redeploy) the dashboard to your Modal workspace with one command:
training-gym setupThis deploys the dashboard app to your workspace, prints its URL, and
saves that URL locally so training launchers can report status to it. You
rarely have to run it yourself — TrainConfig.train() / .launch()
auto-deploy the dashboard on first use — but running it explicitly is
useful after upgrading the package or when setting up a fresh workspace.
Once deployed, open the dashboard any time with:
training-gym openThe dashboard is deployed without authentication by default. To put it behind HTTP Basic Auth, set a password (an empty password disables auth again):
training-gym set-passwordTraining runs at a glance
Section titled “Training runs at a glance”The landing page lists every training run in your workspace:
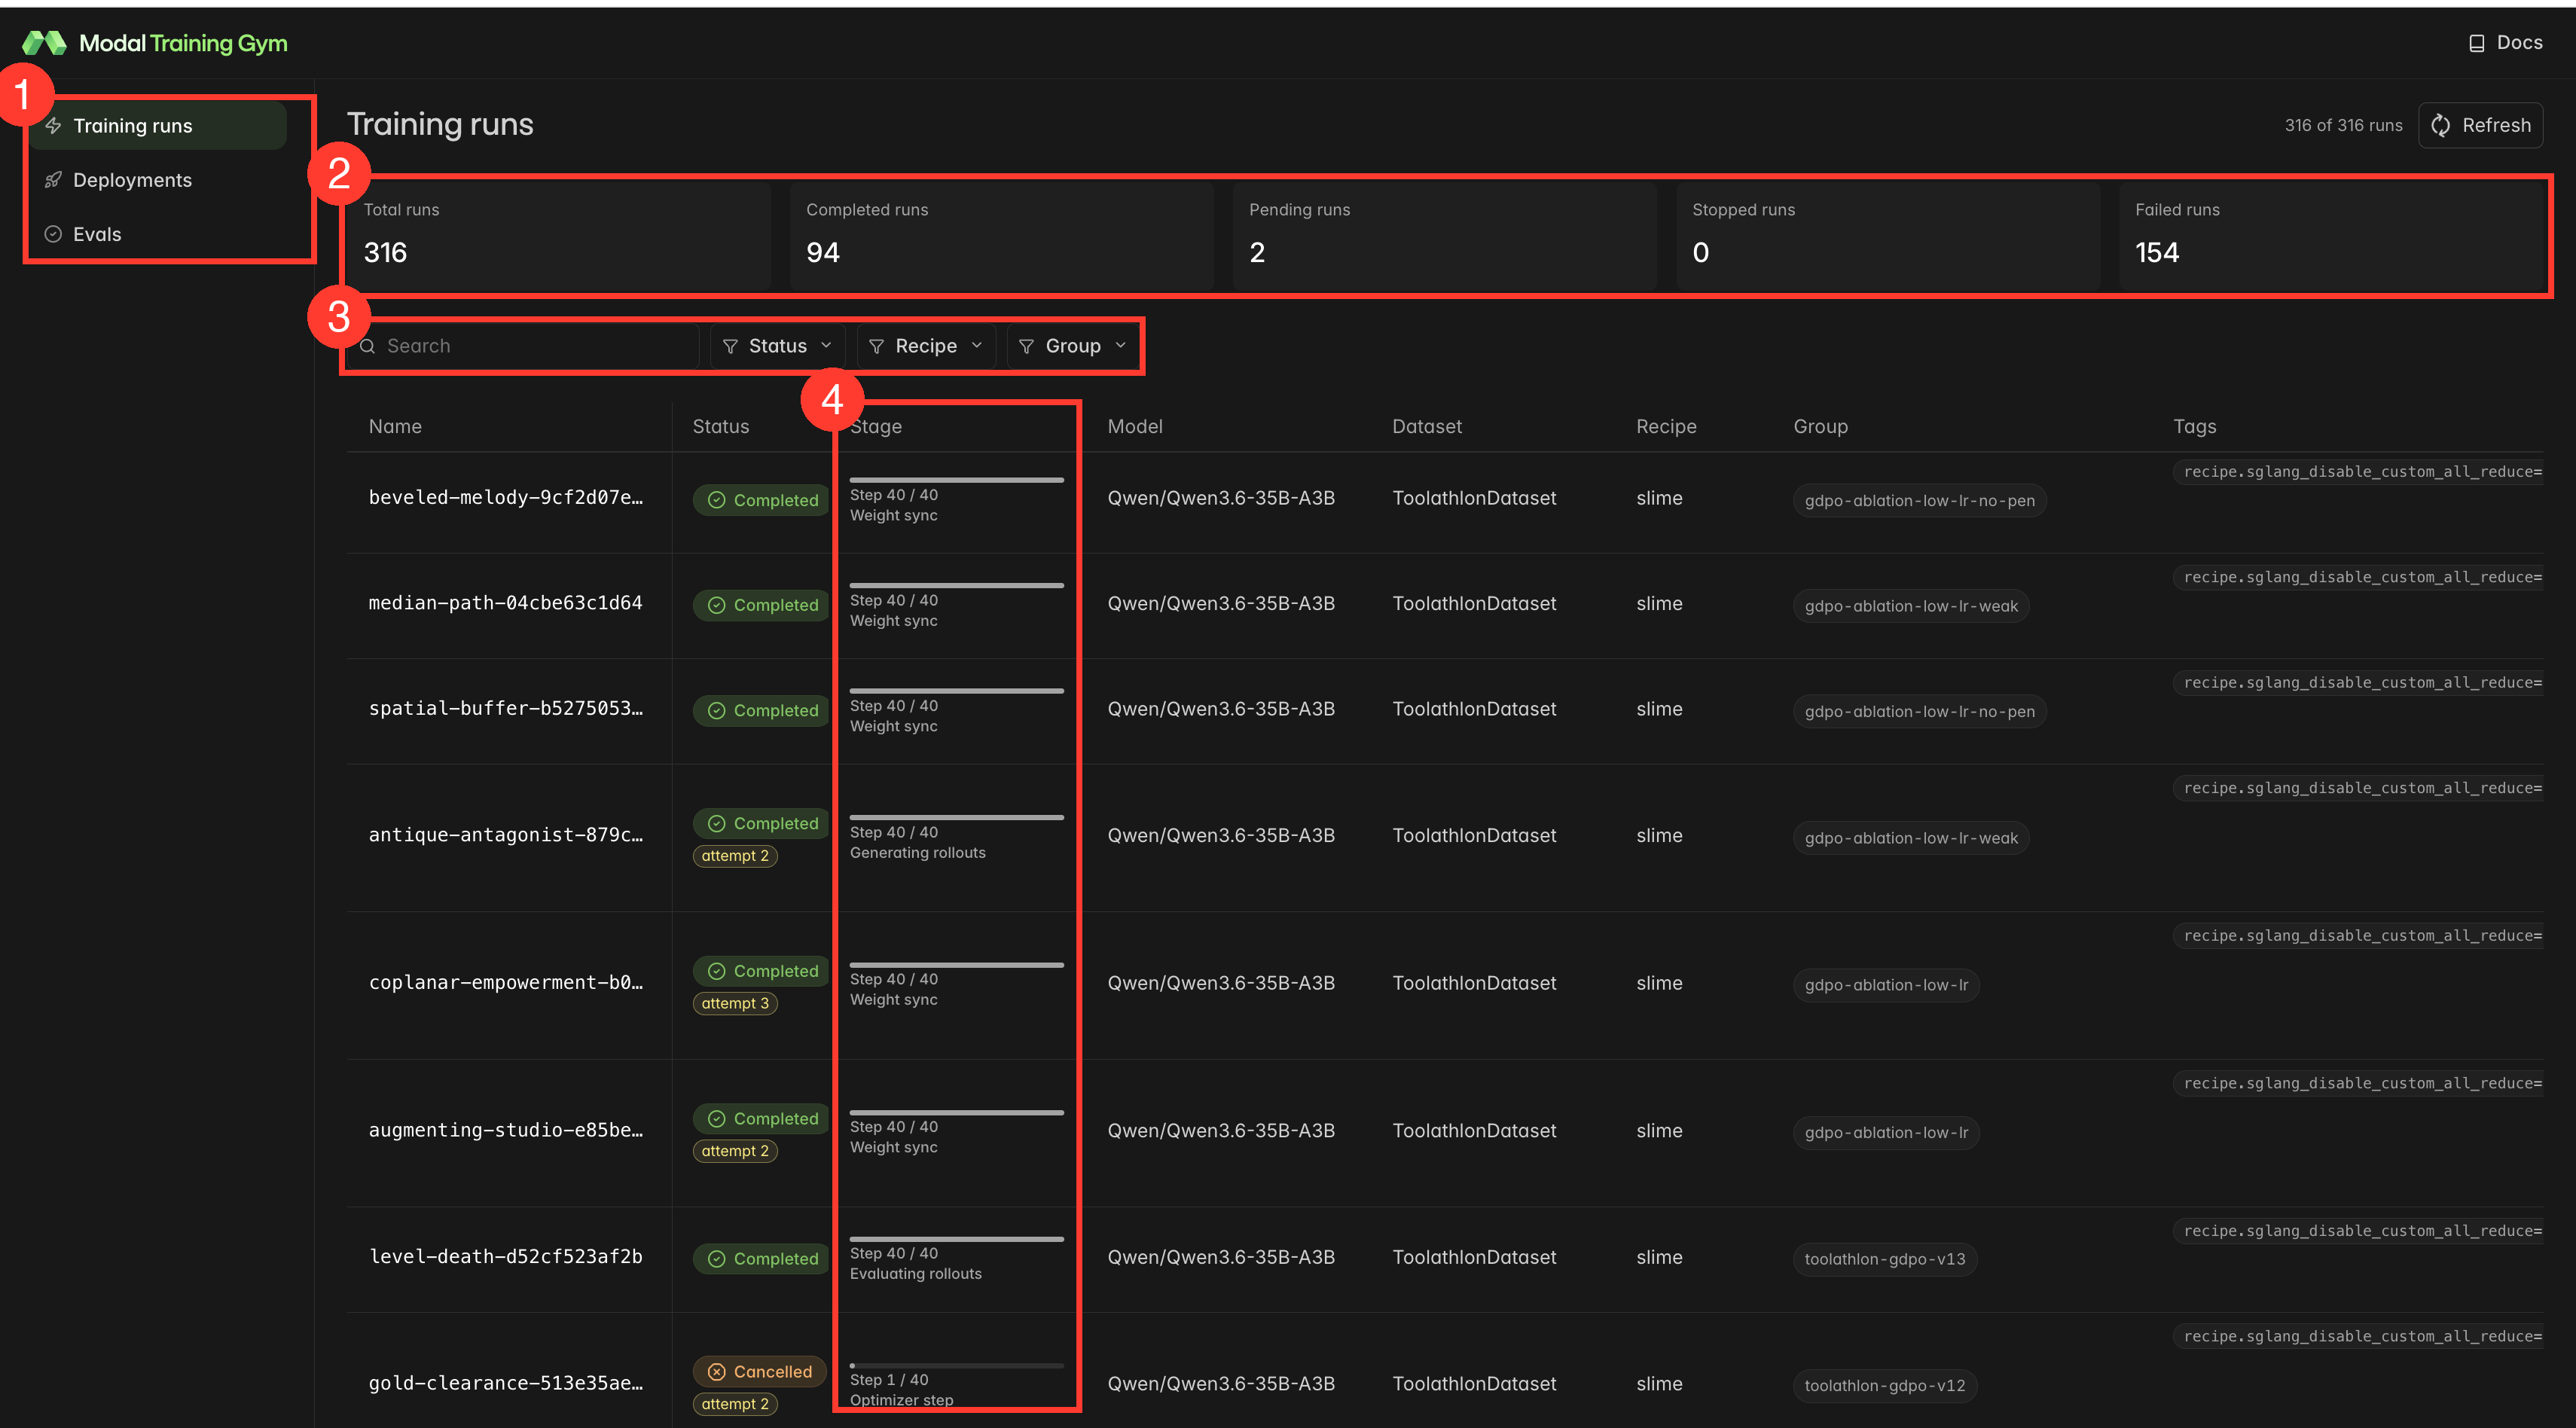
- Sections — switch between Training runs, Deployments (models
served with
DeploymentConfig), and Evals (results fromEvalConfig). - Status cards — workspace-wide counts of completed, pending, stopped, and failed runs.
- Search and filters — search by run name and filter by status,
recipe (framework), or group. Groups correspond to
TrainingGroupsweeps, so you can pull up every variant of a hyperparameter sweep at once. - Stage column — a live progress bar per run: the current step (e.g. Step 40 / 40) and the substep the run is executing right now (Generating rollouts, Weight sync, Optimizer step, …). A wedged run is immediately visible here — its stage stops advancing while the others move.
Each row also shows the model, dataset, recipe, sweep group, and any
per-run tags (e.g. the recipe overrides a TrainingGroup applied to that
variant).
Inside a run: the Summary tab
Section titled “Inside a run: the Summary tab”Click any run to open its detail view:
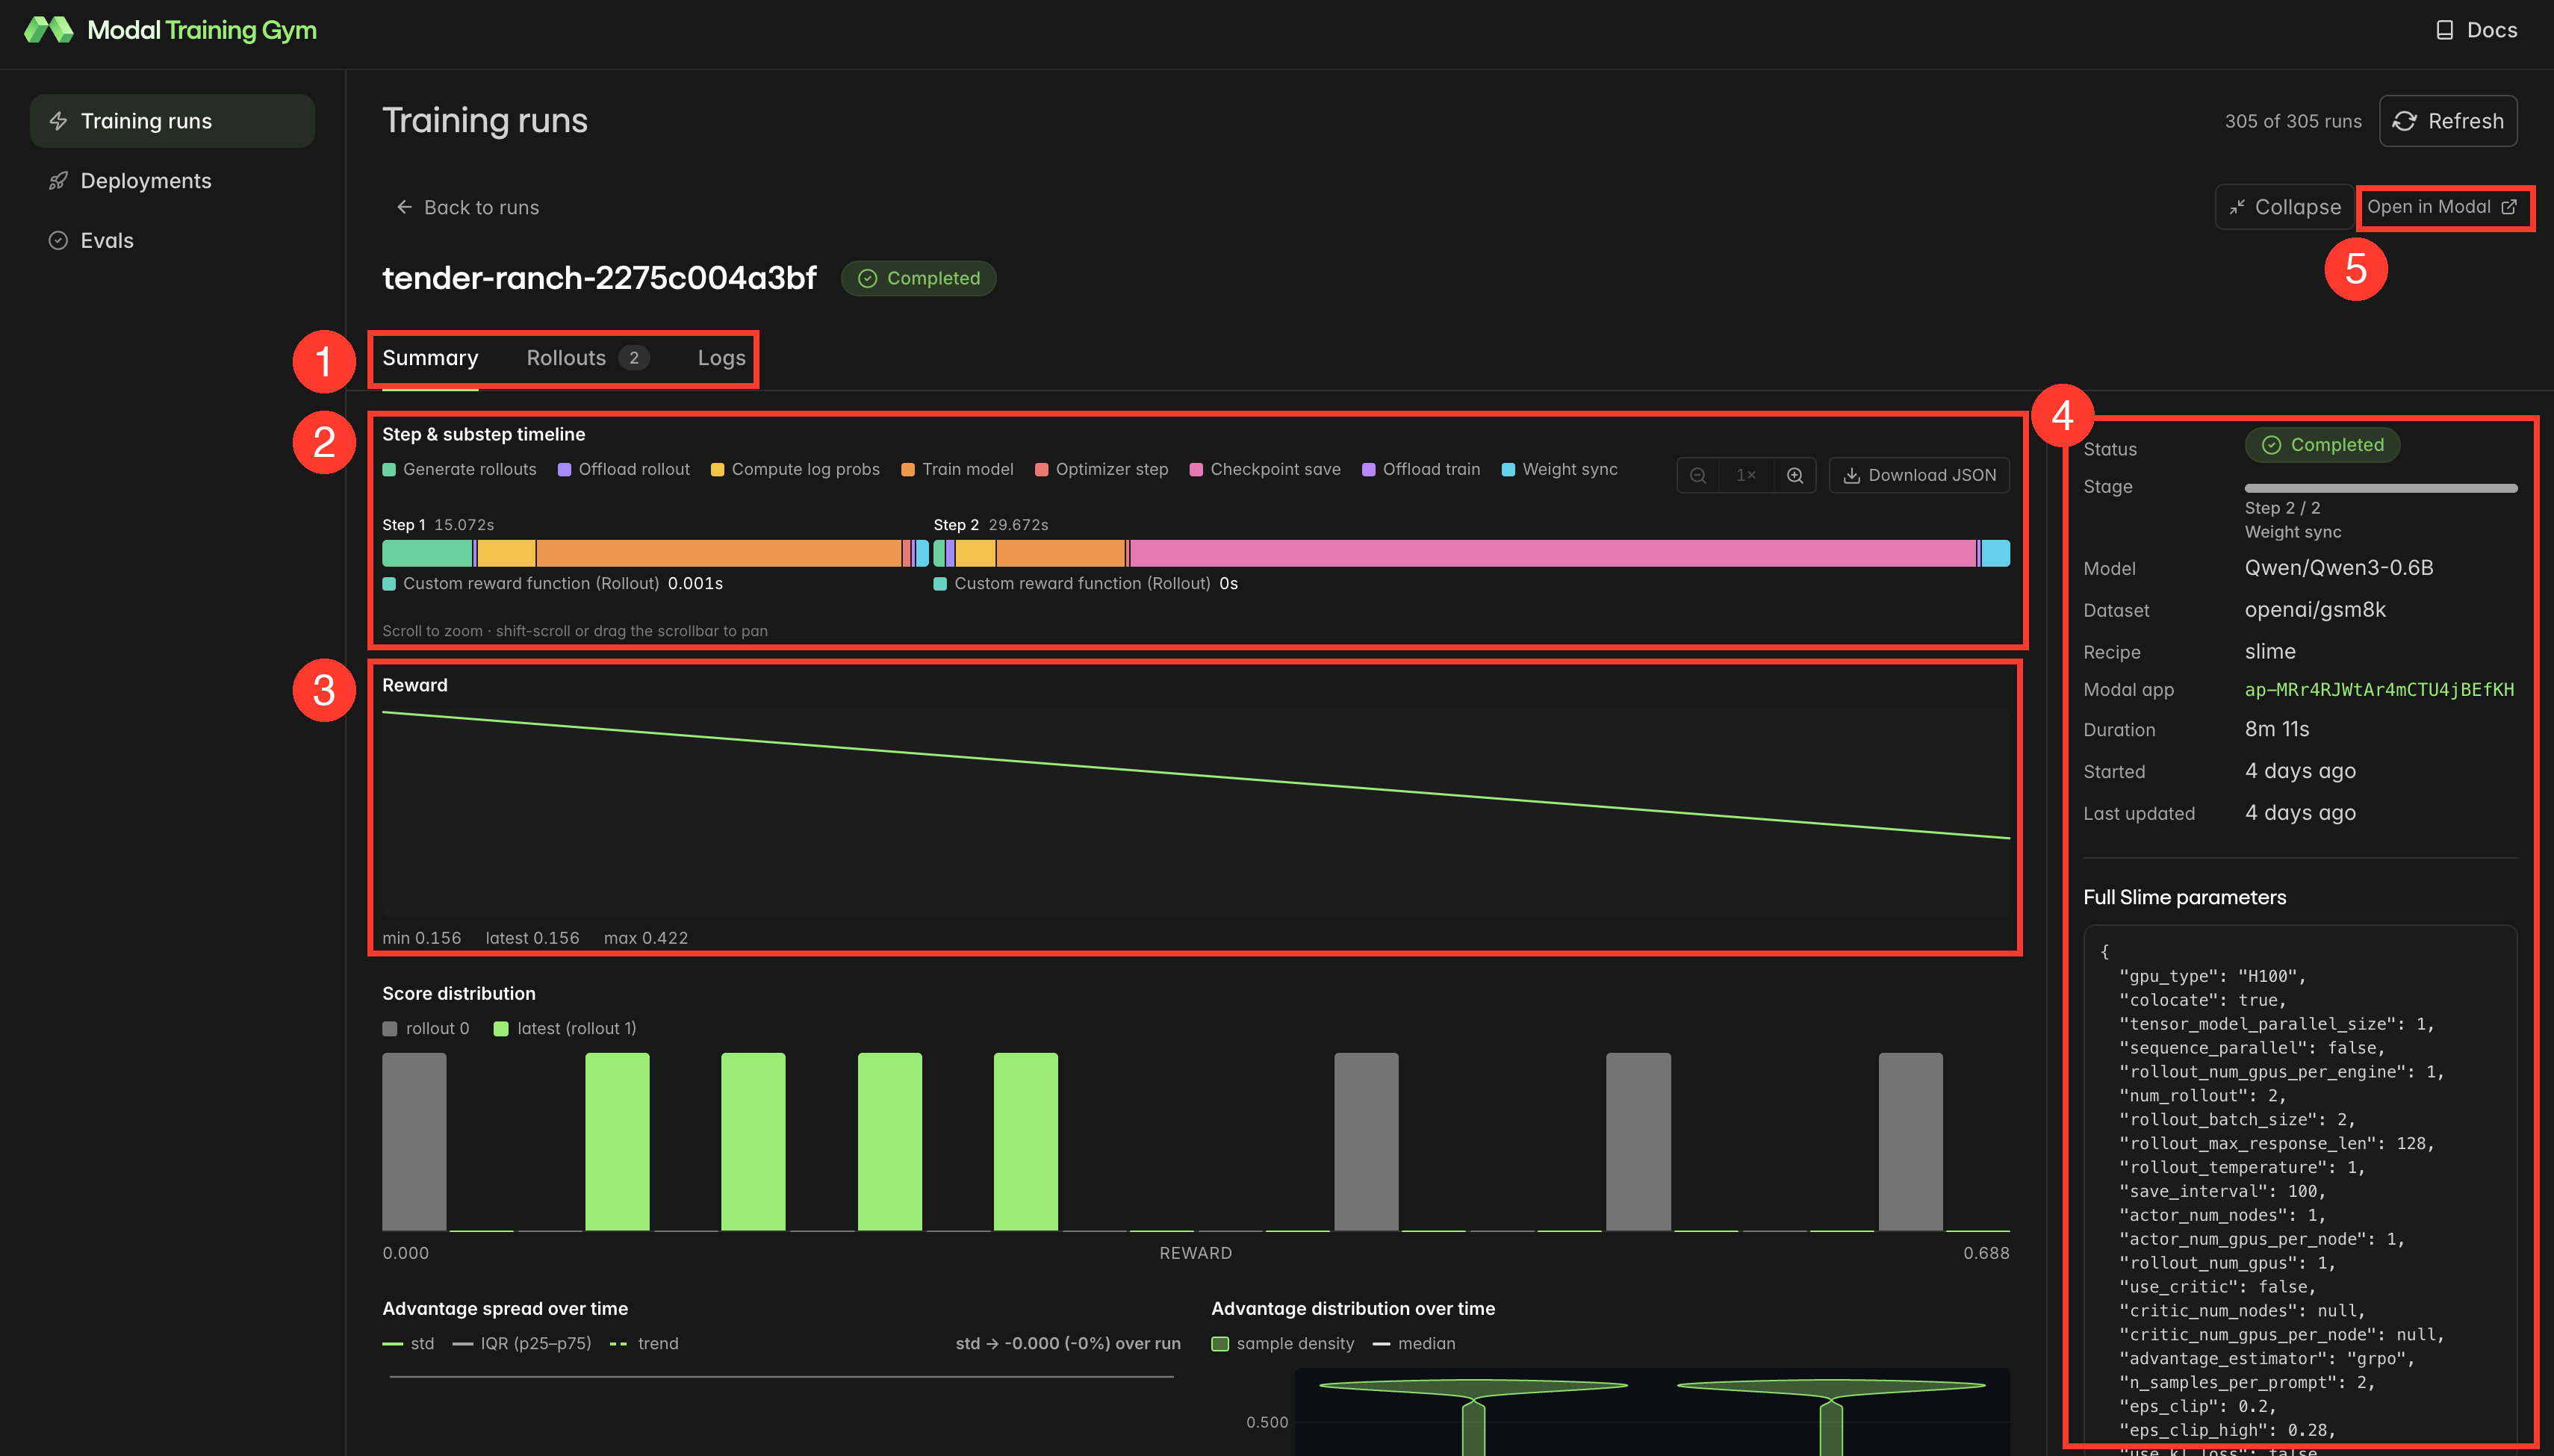
- Tabs — Summary (charts and timings), Rollouts (generated samples per rollout), and Logs (streamed container logs).
- Step & substep timeline — a per-step breakdown of where wall-clock time goes (more below).
- Reward chart — mean reward per step, with min / latest / max. The score distribution and advantage charts below it show how rewards are spread within each rollout — useful for spotting reward collapse (all-equal rewards) long before the mean flatlines.
- Run details panel — status, current stage, model, dataset, recipe, duration, plus the full resolved recipe parameters that were actually used (after model presets were merged), so you can confirm exactly what configuration a run trained with.
- Open in Modal — deep-link to the underlying Modal app for container-level debugging; runs logged to W&B also get a W&B link.
Profile step and substep timings
Section titled “Profile step and substep timings”The Step & substep timeline (callout 2 above) is the dashboard’s built-in profiler. Each training step renders as a horizontal bar, labeled with its total duration and segmented by substep:
- Generate rollouts — sampling from the inference engine
- Offload rollout / Offload train — moving weights between the rollout and training engines
- Compute log probs — forward passes for the RL objective
- Train model — the actual gradient steps
- Optimizer step, Checkpoint save, Weight sync — bookkeeping that keeps the rollout engine on-policy
Custom phases emitted by your code (e.g. a custom reward function) appear as their own markers with per-call durations, so you can tell whether a slow step is the framework or your reward.
Reading the timeline:
- Scroll to zoom, shift-scroll or drag the scrollbar to pan — zoom into a single step to compare substep widths precisely.
- A healthy GRPO step is usually dominated by Generate rollouts and Train model. If Generate rollouts keeps growing step over step, look at rollout lengths (responses may be hitting the max length); if Weight sync or the offload substeps dominate, the cluster shape is likely misconfigured for the model size.
- Download JSON exports the raw timing data — every step and substep with start/end timestamps — for offline analysis or regression tracking across runs.
Inspect rollouts sample by sample
Section titled “Inspect rollouts sample by sample”The Rollouts tab shows what the model actually generated at each rollout step — the fastest way to debug a flat reward curve:
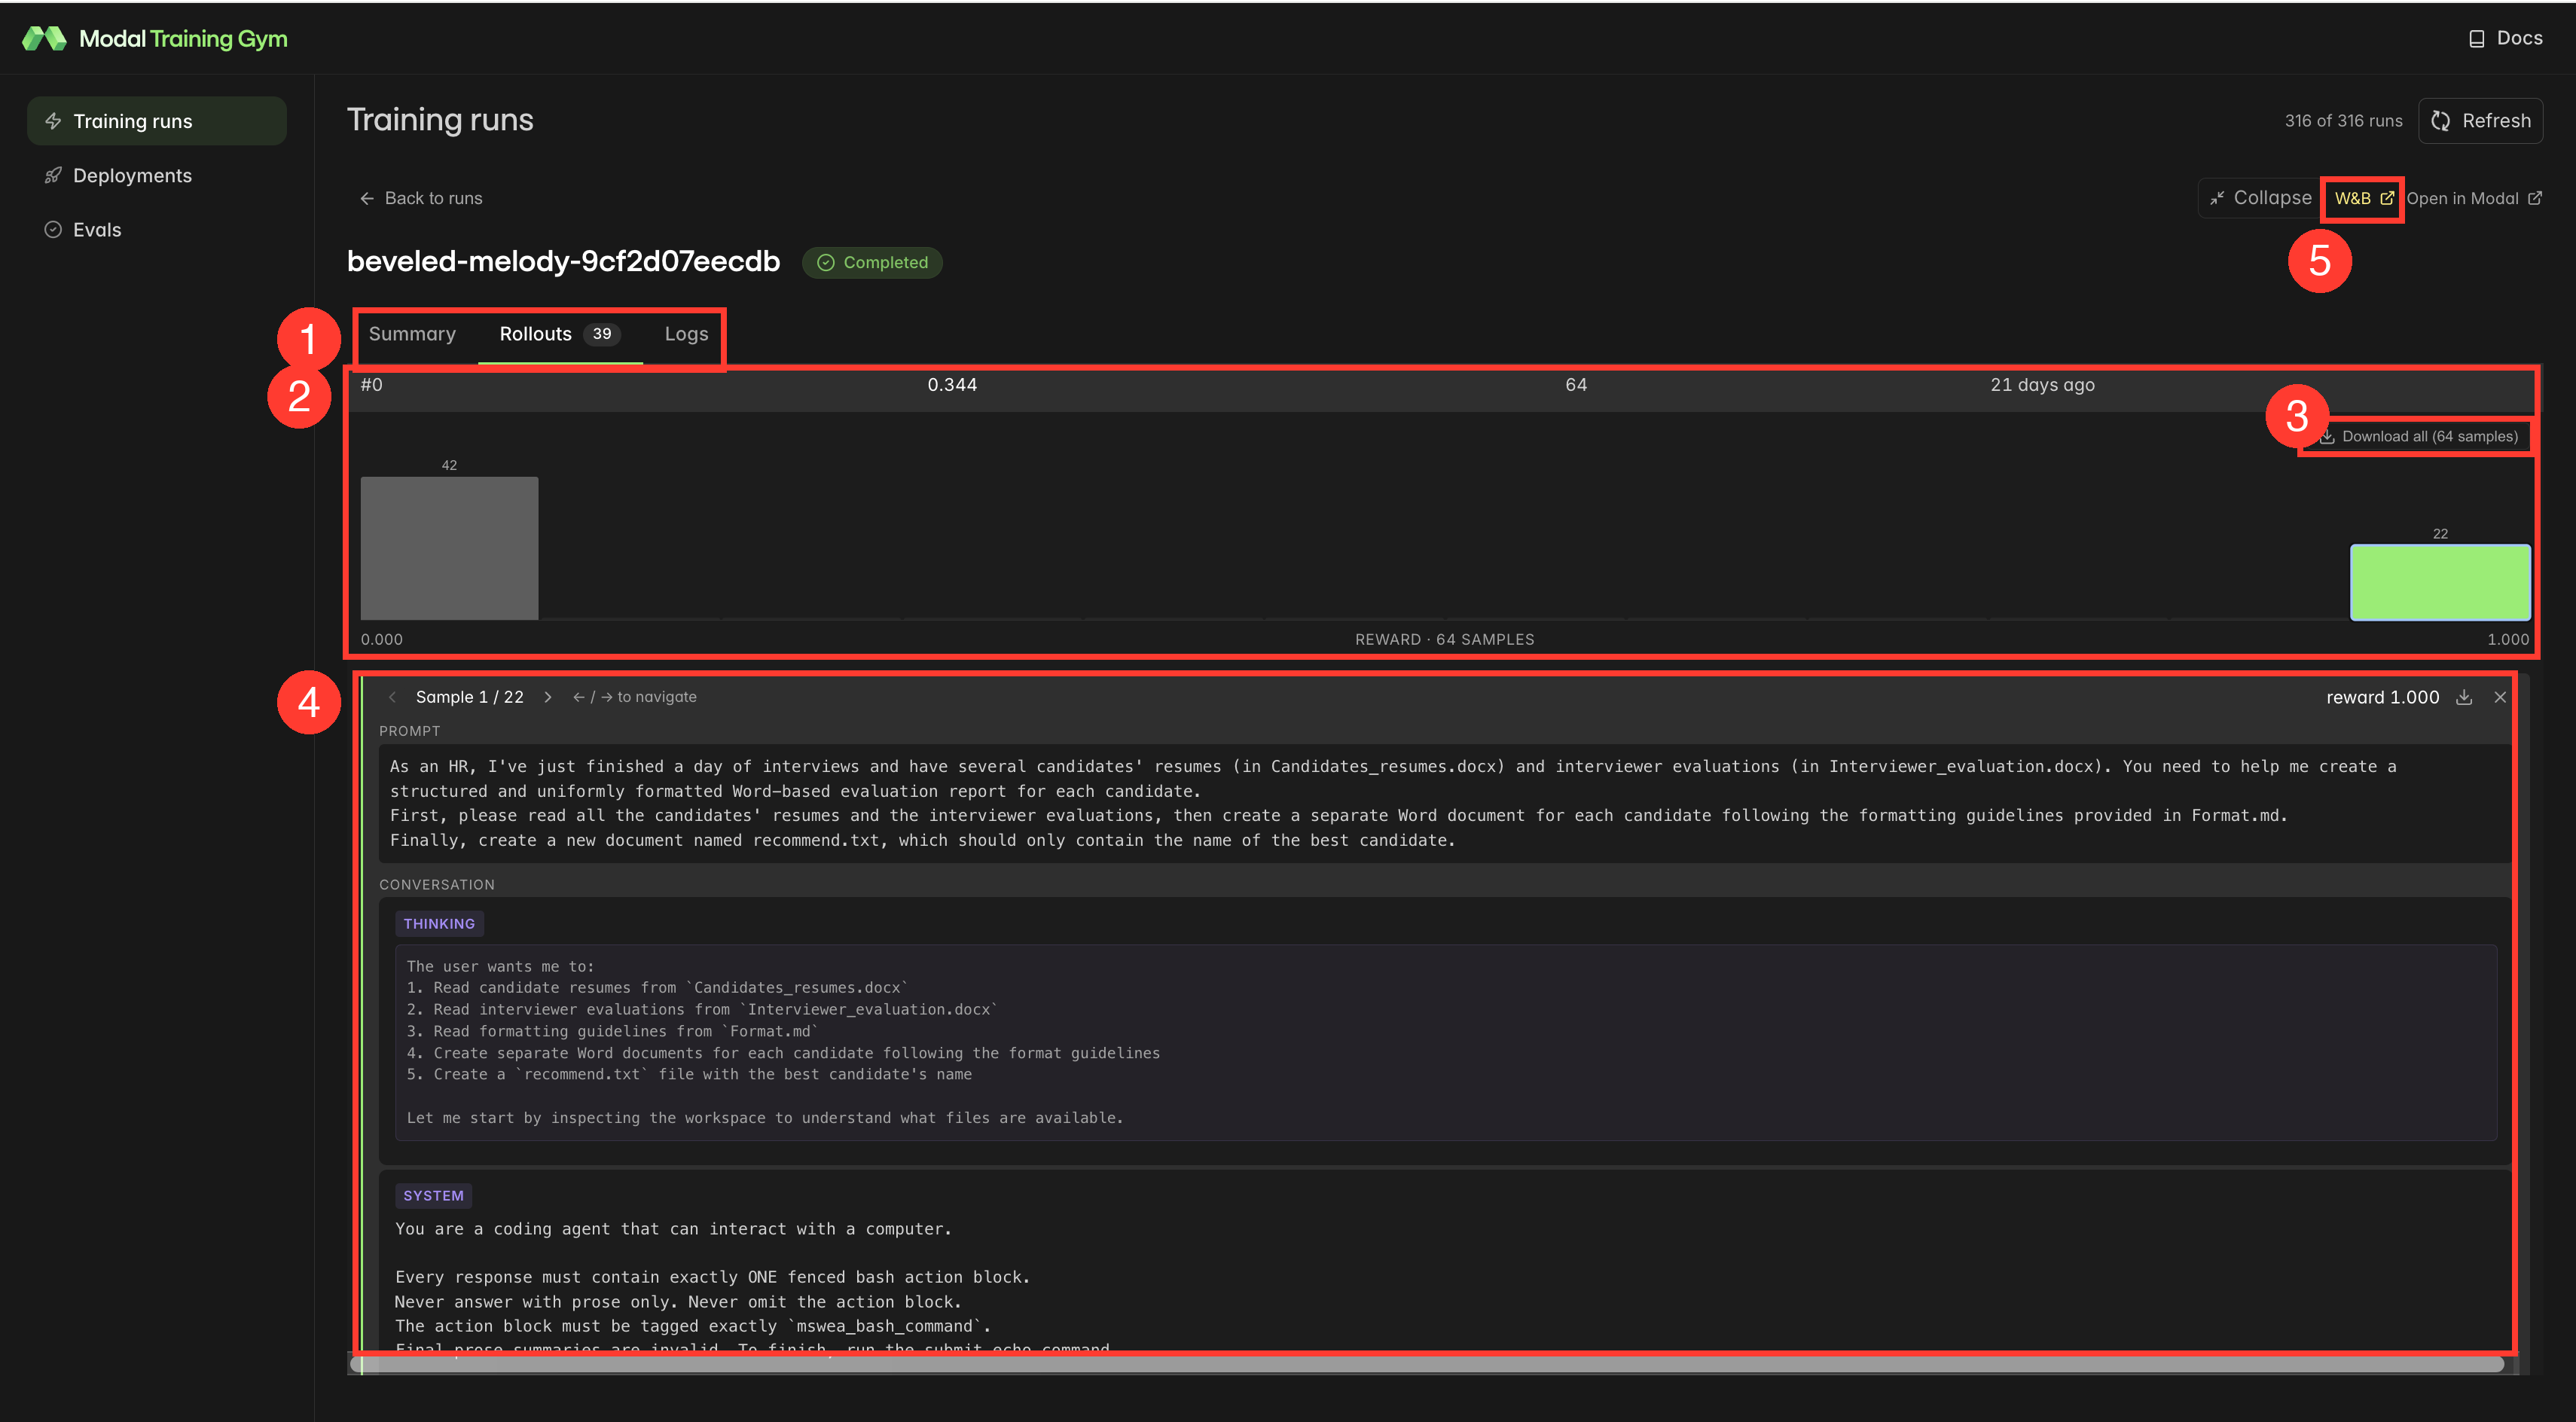
- Rollouts tab — the badge shows how many rollout steps were recorded for this run.
- Reward histogram — the reward distribution across all samples in the selected rollout. A bimodal split like the one above (a bar at 0.0 and a bar at 1.0) is what a healthy verifiable reward looks like; a single spike means every sample got the same reward and the step carries no learning signal.
- Download all — export every sample in the rollout as JSON.
- Sample viewer — click a histogram bar to page through its samples
(
←/→to navigate): the full prompt, the system message, the model’s thinking, every conversation turn, and the reward that sample received. - W&B link — jump to the same run in Weights & Biases.
Housekeeping
Section titled “Housekeeping”Metadata from old failed or cancelled runs accumulates in the dashboard over time. Prune it with:
training-gym cleanup --older-than-days 7 --dry-runDrop --dry-run to actually delete. Completed runs are never touched.