
Observability dashboard
When doing RL post-training, experiment management and observability are particularly tricky. While all metrics are captured by the underlying framework, the observability dashboard gives you a live view of the most important information; for example, reward curves, score/advantage distributions, traces, and step timing.
Since it’s just a Modal App, you can get a dedicated dashboard for your workspace with:
training-gym setupNote that you’ll have to rerun this command when you bump your training-gym version.
Once deployed, open the dashboard any time with:
training-gym openBy default, the dashboard is deployed without authentication. To put it behind HTTP Basic Auth, set a password:
training-gym set-passwordAt a glance
Section titled “At a glance”The landing page lists every training run in your workspace:
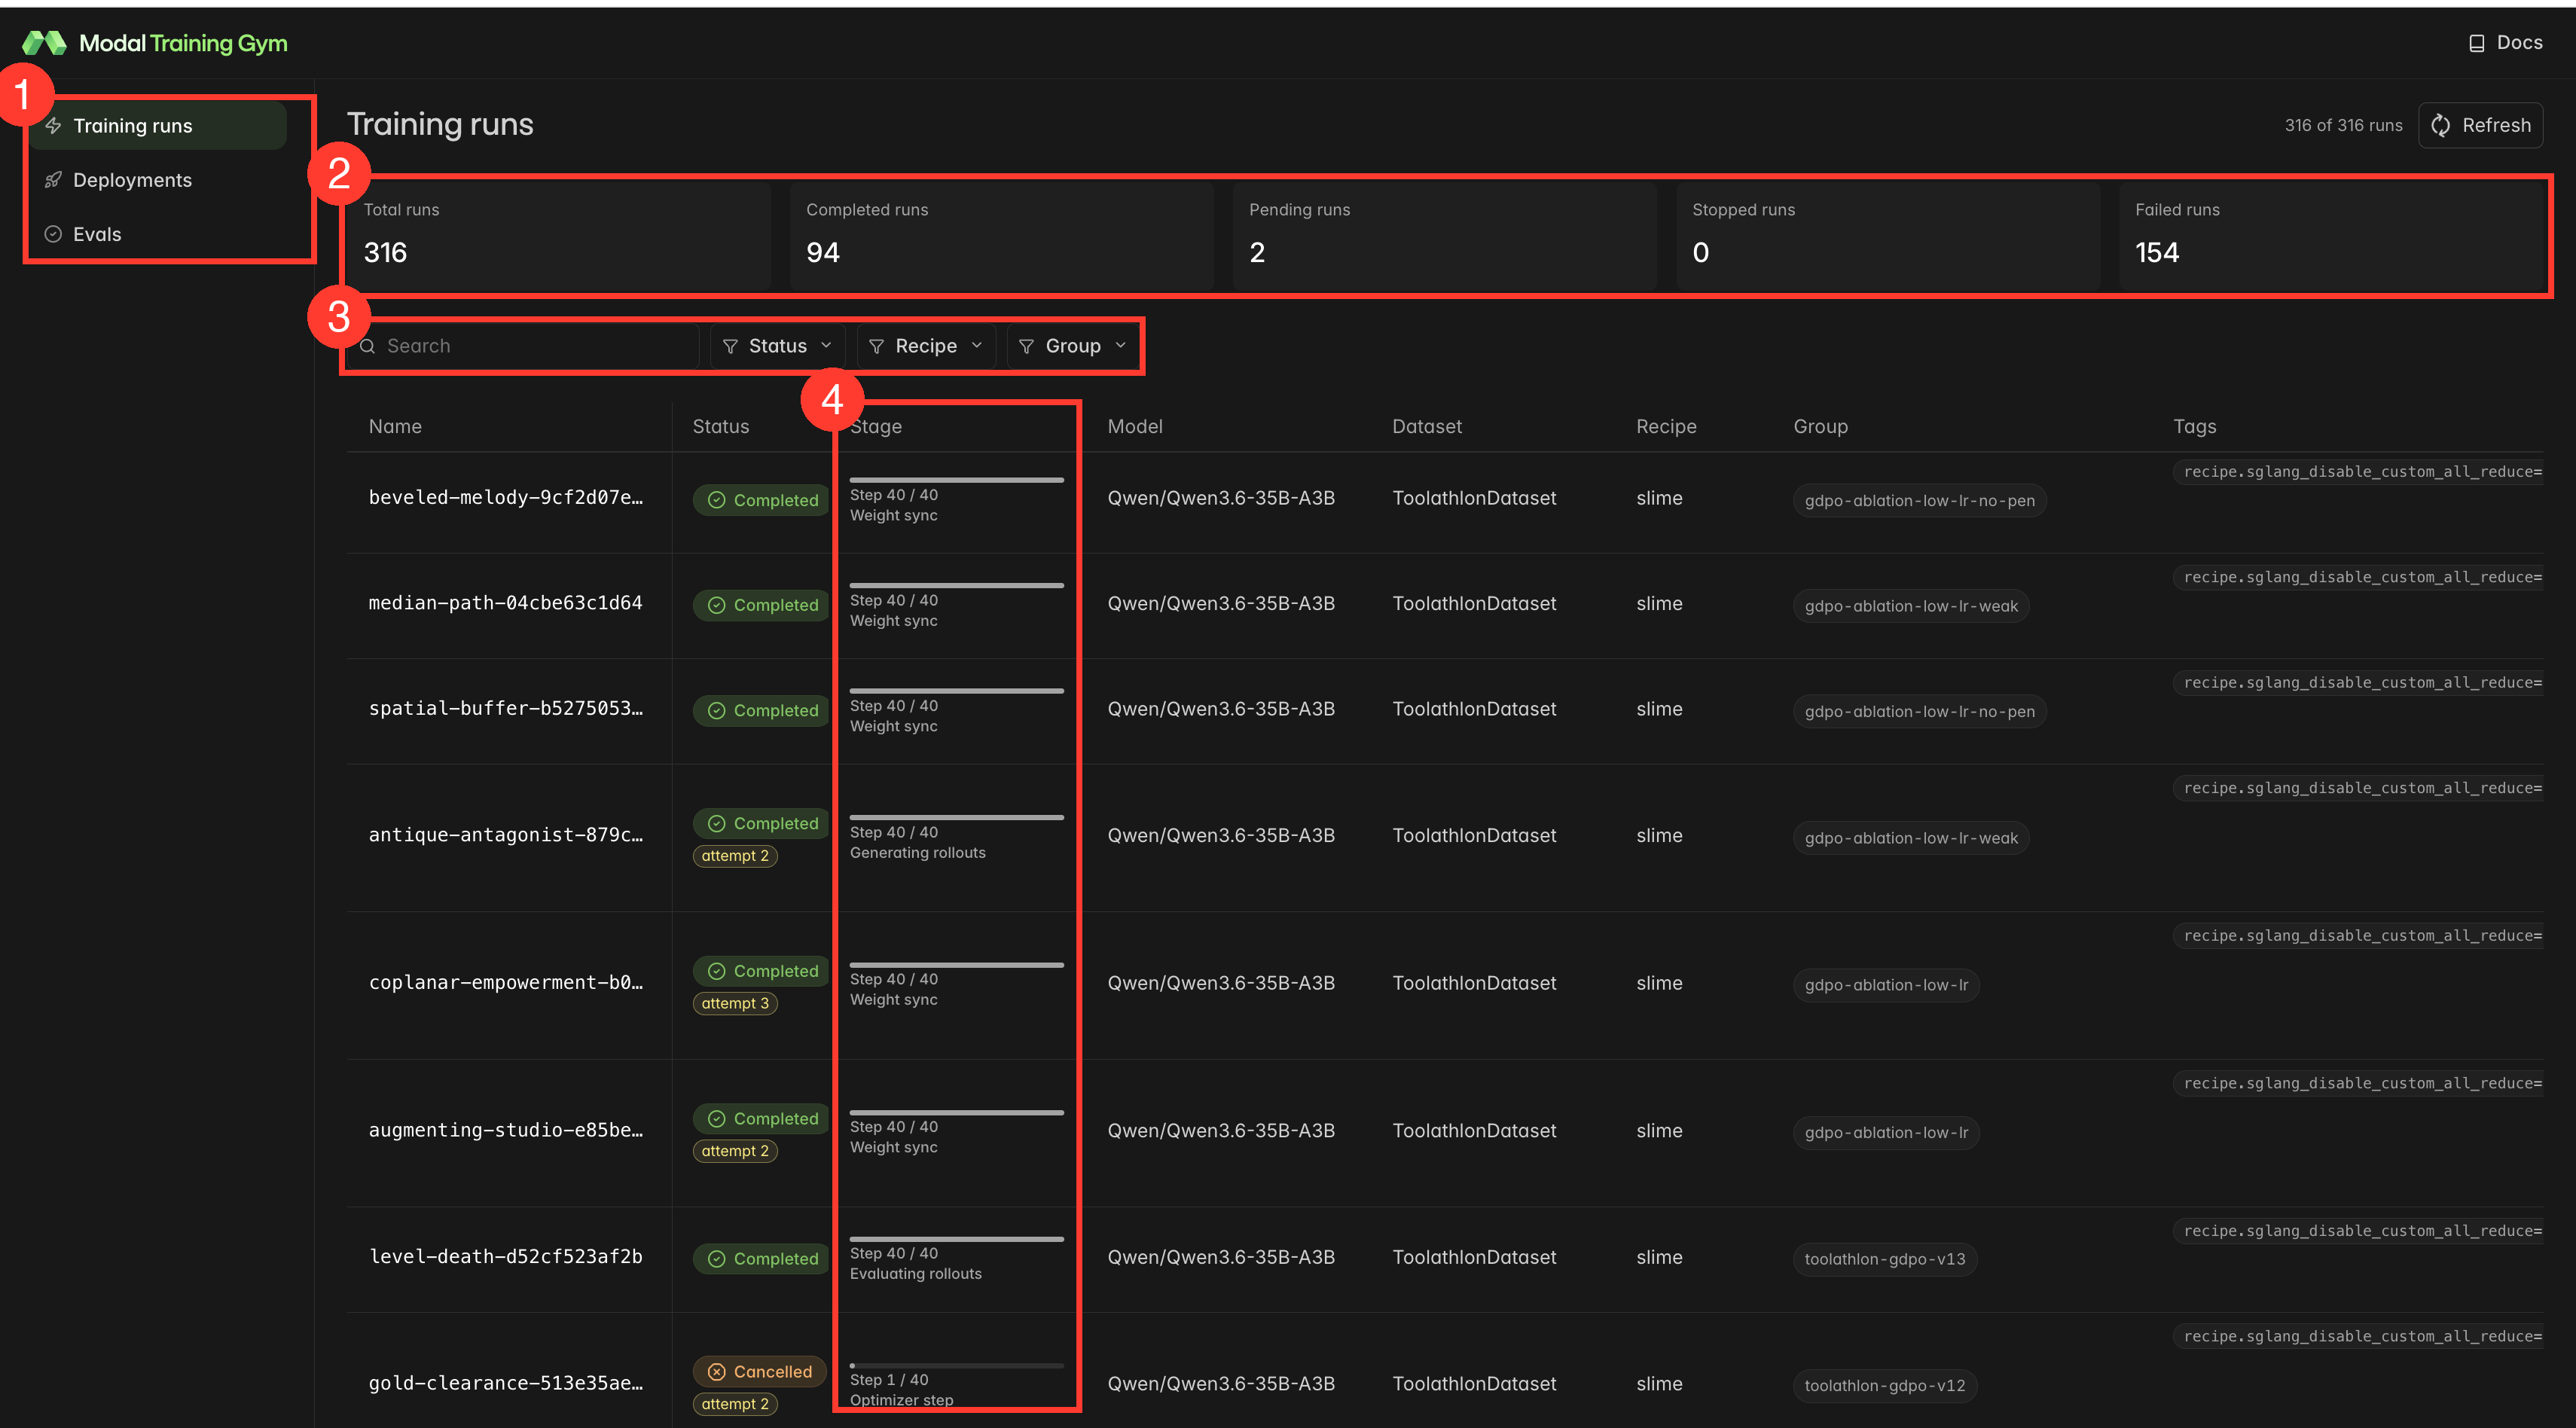
You can easily see:
- Status of all your runs.
- Live progress of each run.
Per run
Section titled “Per run”Click any run to see a detailed view:
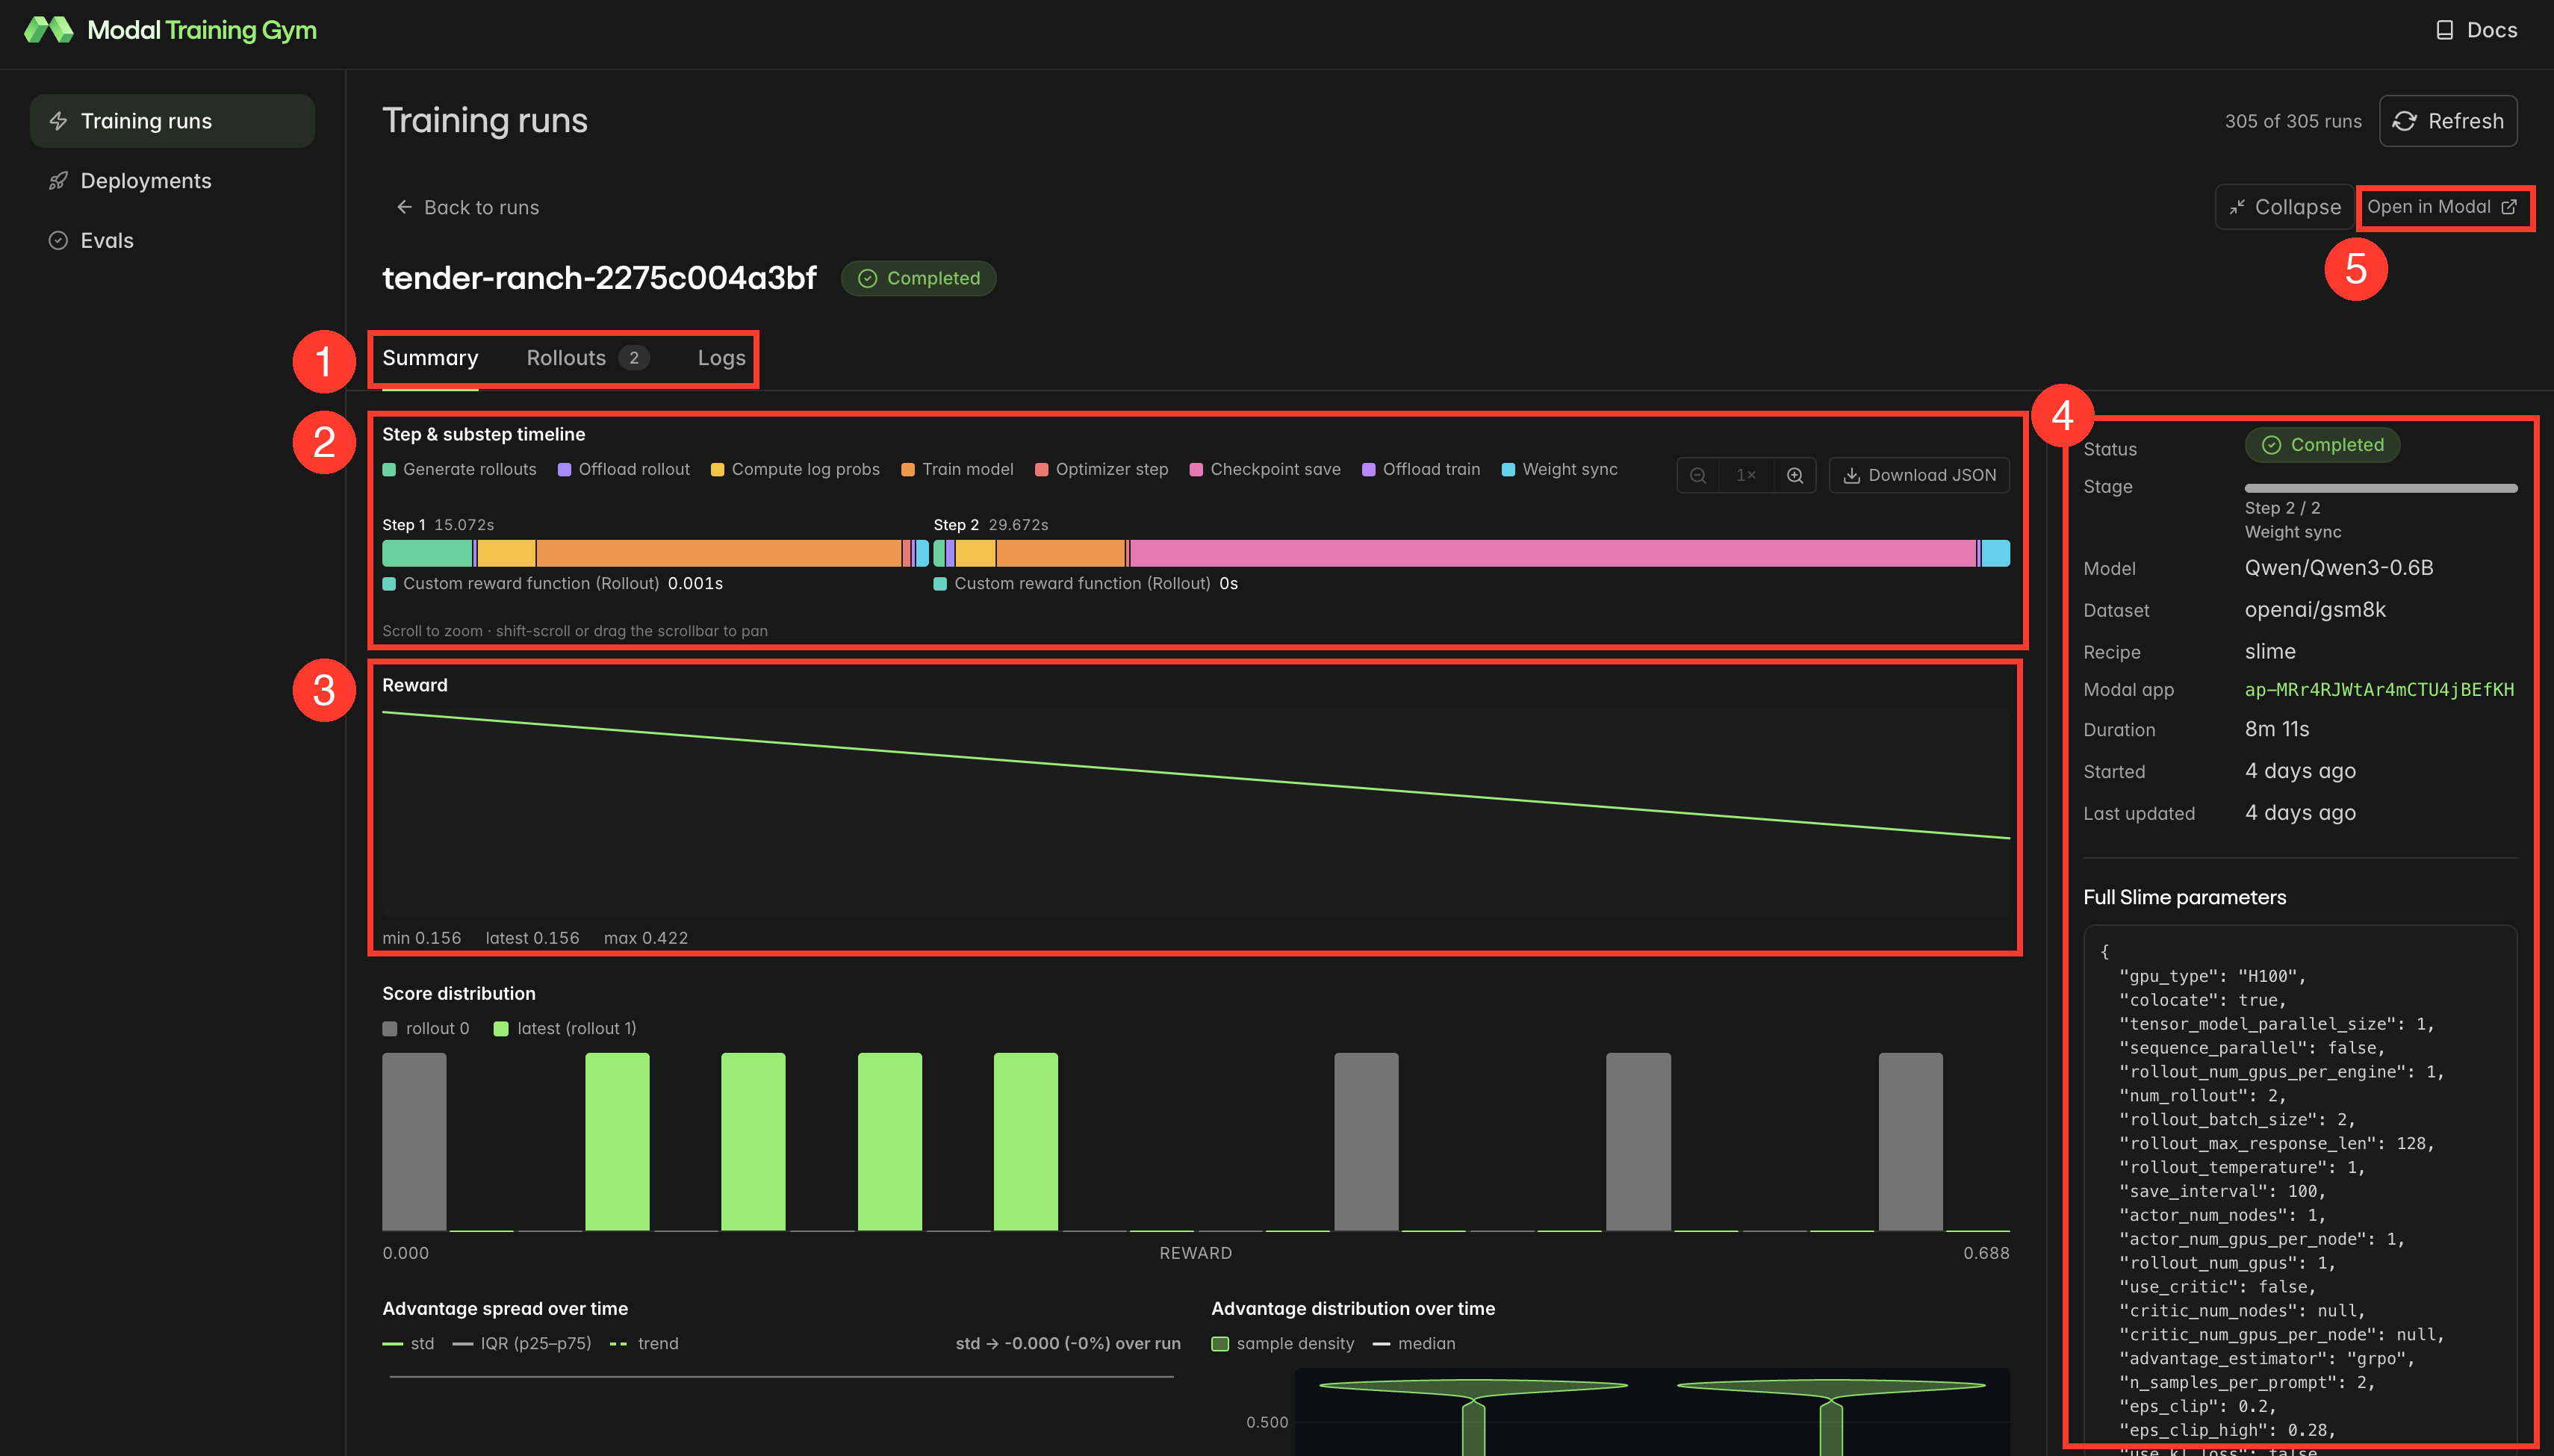
Some highlights:
- Per-step breakdown of wall-clock time for the run; see more below.
- Mean reward of all rollouts per step; past returns do not guarantee future results.
- Score distribution and advantage charts; useful for spotting reward collapse (all-equal rewards) long before the mean flatlines.
- Link to the underlying Modal app for container-level debugging.
The step and substep timeline is the dashboard’s built-in profiler. Each step is segmented by:
- Generate rollouts: sampling from the inference engine.
- Offload rollout/train: moving weights between the rollout and training engines.
- Compute log probs: forward passes for the RL objective.
- Train model: the actual gradient steps.
- Optimizer step, checkpoint save, weight sync: bookkeeping that keeps the rollout engine on-policy.
You can scroll to zoom and drag to pan for precise viewing.
Some tips:
- A healthy GRPO step is usually dominated by rollout generation and model training.
- If rollout generation duration grows step over step, look at rollout lengths as responses may be hitting the max length.
- If weight syncing or the offload substeps dominate, the cluster shape is likely misconfigured for the model size.
Custom phases emitted by your code (e.g., a custom reward function) appear as their own markers for easy debugging and tracking.
Per rollout
Section titled “Per rollout”You can even inspect each rollout to quickly debug poor performance:
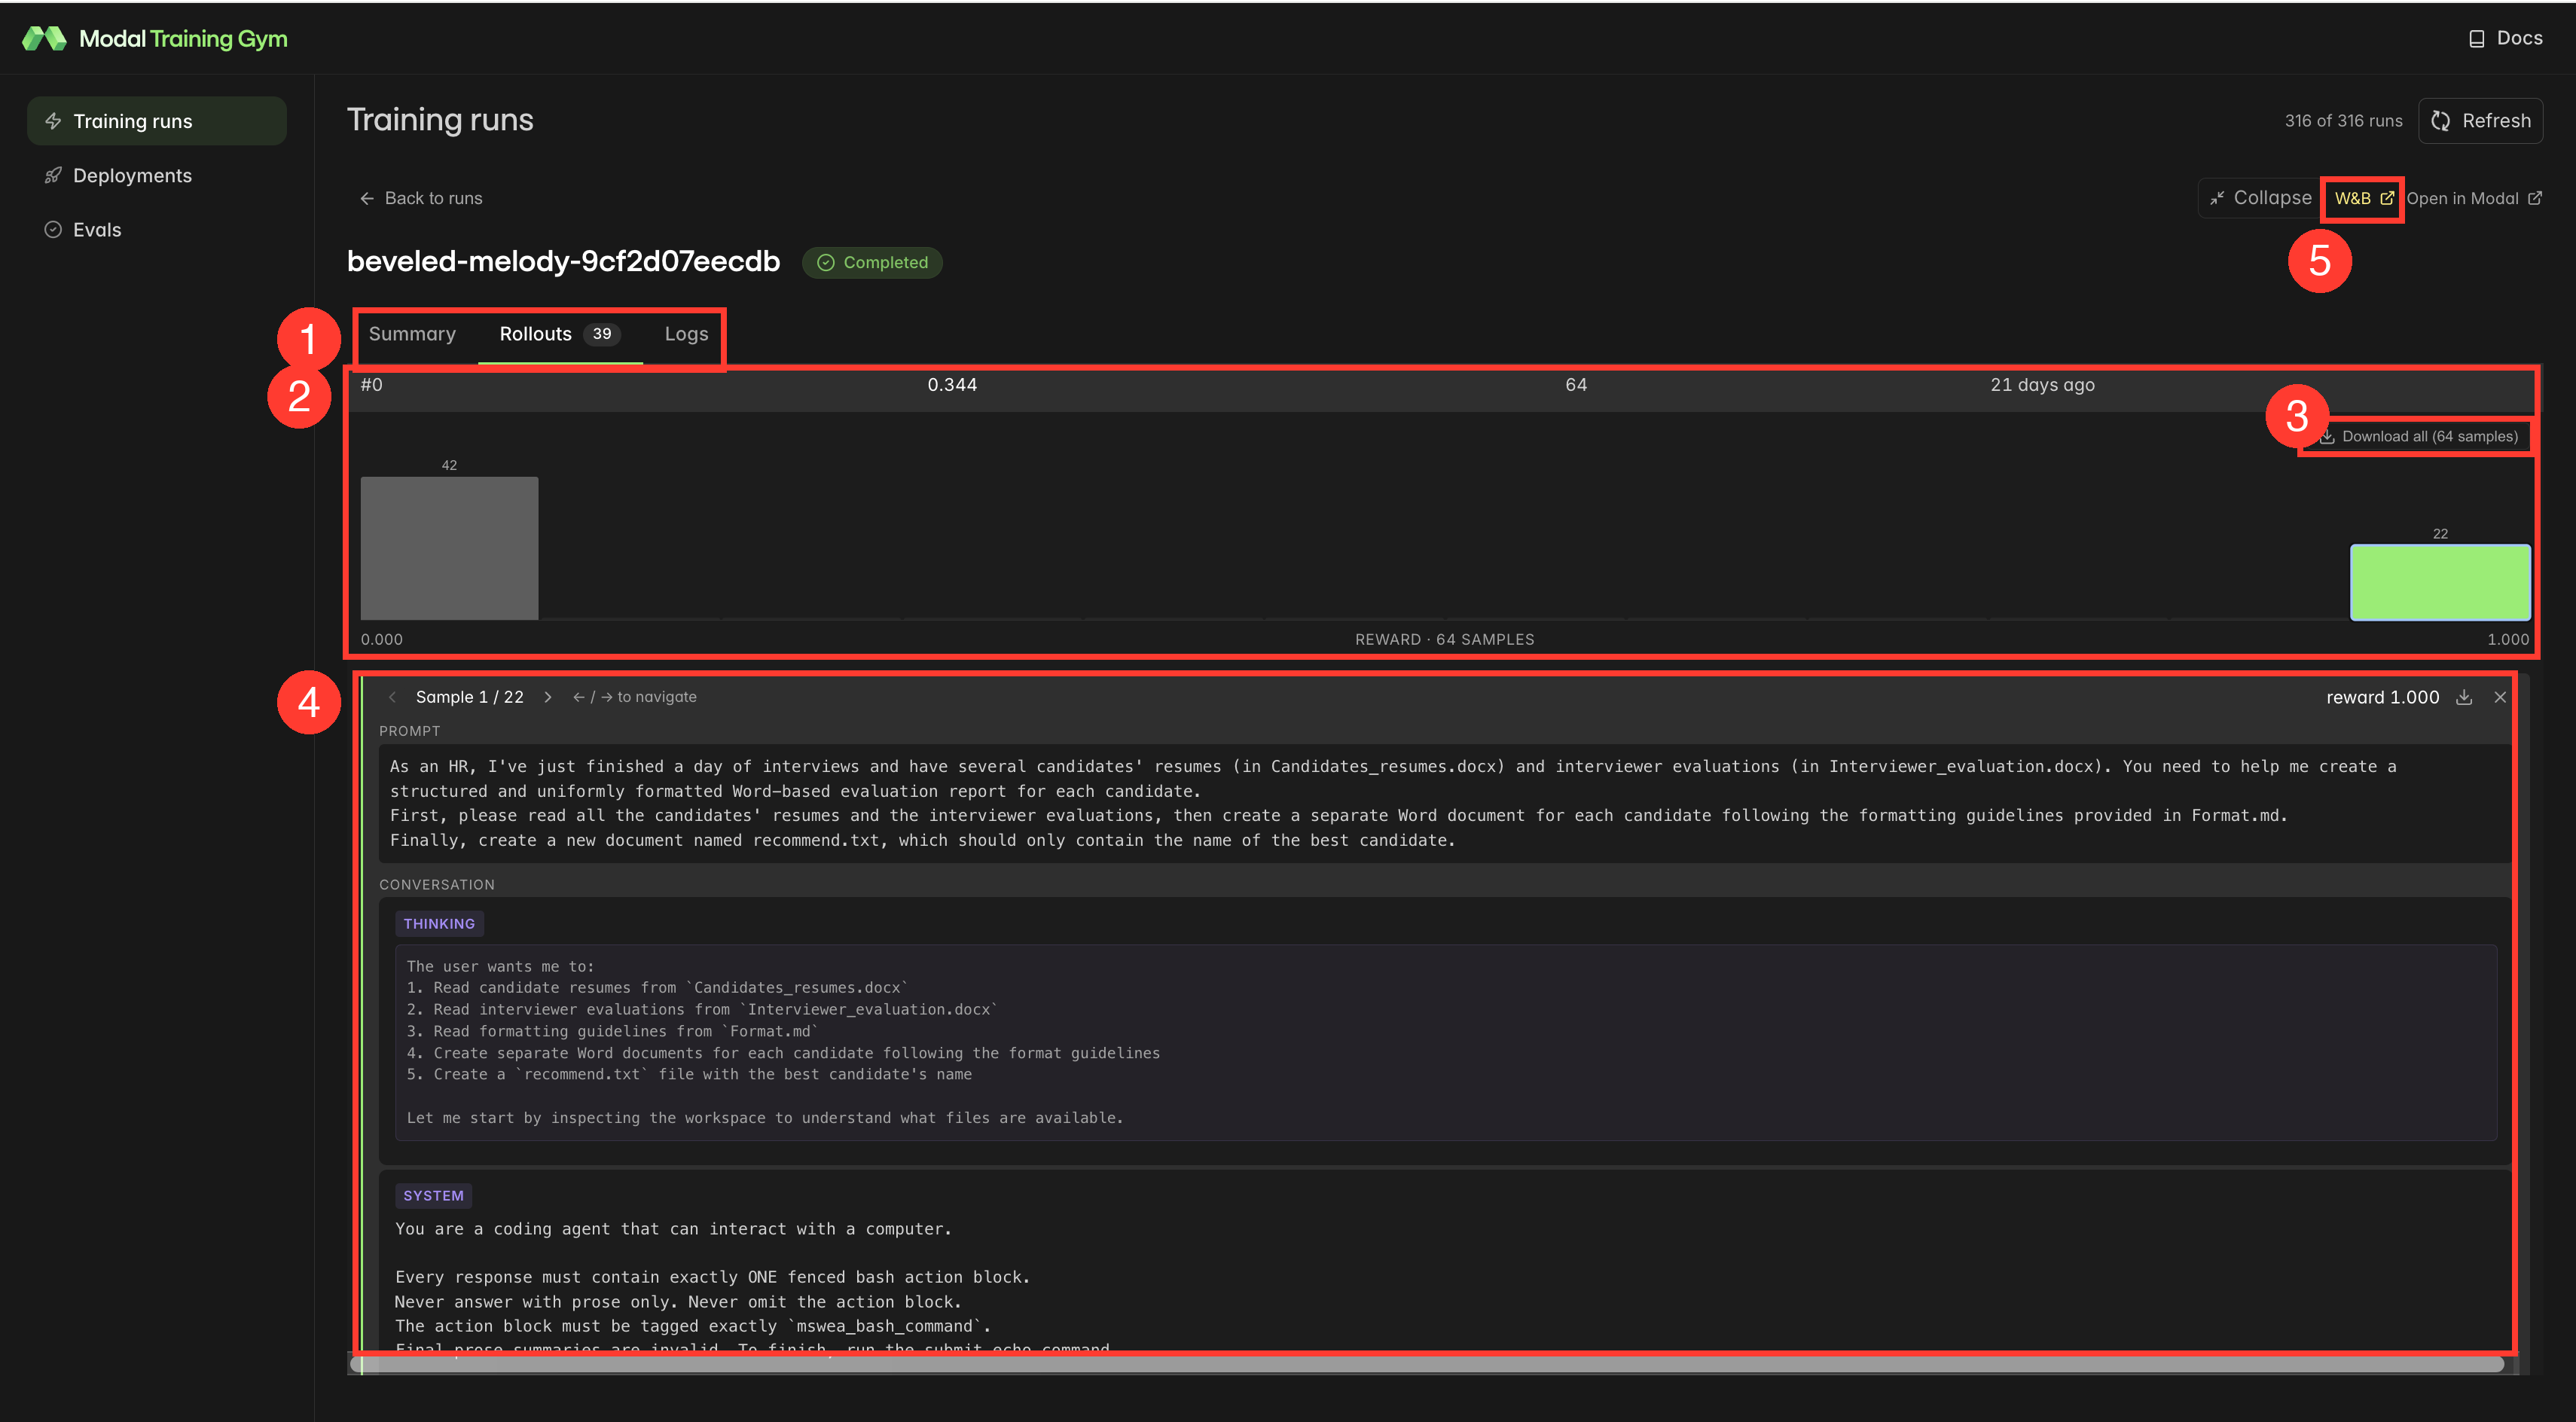
You’ll see:
- Same timeline but for each step.
- Reward distribution across all rollouts. A healthy run is represented as a bimodal distribution for the majority of the run, while an unhealthy one will gravitate towards one end or the other before training has completed. Pictured above is one indicative of the end of a run, as most rollouts have already saturated the reward.
- Per-rollout trace that shows the full prompt, the system message, the model’s thinking, every conversation turn, and the reward.
Housekeeping
Section titled “Housekeeping”Metadata from old failed or cancelled runs will accumulate in the dashboard over time. See what will be removed with:
training-gym cleanup --older-than-days 7 --dry-runThen execute:
training-gym cleanup --older-than-days 7